
Map Viewer Information
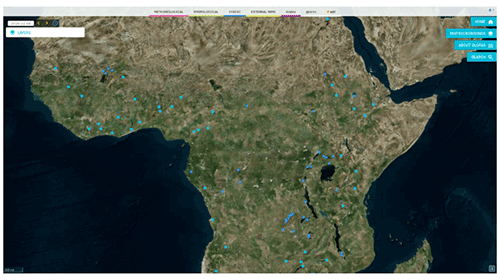
Map viewer: Interactive visualisation interface
- Meteorological: summarising precipitation forecasts over the first 10-day period of the forecast horizon in GloFAS 30-day
- Hydrological: summarising the latest GloFAS forecasts and GloFAS Seasonal forecasts
- Flood risk: summarising the estimated flood extent and the impact on population in GloFAS 30-day
- Static: showing background information such as inundation plains, or lakes and reservoirs
- External WMS: where users can import new layers produced externally and available through the WMS standard
Each layer can be ordered or switched on and off, and the date of the displayed forecast can be selected using the date tool. By default GloFAS map viewer is set to the current date. Note that the earliest forecast available is for the pre-operational GloFAS system, 1st January 2011.

Map viewer layer tabs (left) and example of description available from the (i) symbol

GloFAS map viewer date tool and layer visualisation and ordering

Example of meteorological layer showing the median of the ECMWF ENS precipitation forecast for the first 10 days of the forecast horizon (top) and probability for the ECMWF ENS precipitation forecast to exceed 150 mm in the first 10 days of the forecast horizon (bottom)
GloFAS forecasts precipitation overview: meteorological situation maps
Summary of the total precipitation forecast used in GloFAS forecasts is provided as a set of four precipitation forecast maps of the first 10-day period of the forecast horizon, available from the Meteorological layer:
- ECMWF-ENS total precipitation median of the ensemble distribution over the 10-day forecast range ("Accumulated Precipitation" layer)
- Probability of ECMWF-ENS total precipitation to exceed 50/150/300 mm over the 10-day forecast range (respectively "Precipitation Prob. > 50 mm", "Precipitation Prob. > 150 mm and Precipitation Prob. > 300 mm" layers)

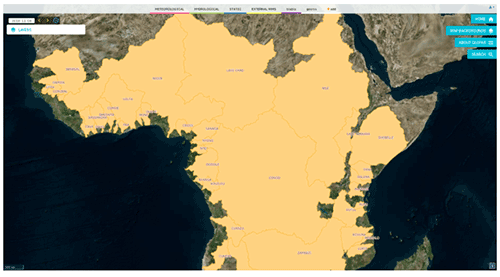
Snapshot of GloFAS map viewer showing the "5 Year Return Period Exceedance"
and "Reporting Points" layers displayed together (left) and the "Flood summary for days 1-3" (right)

Example of forecast hydrograph and consistency diagram for GloFAS 30-day. This is displayed as a pop-up window when clicking on the corresponding threshold exceedance icons
GloFAS forecasts: Flood early detection up to 30 days in advance
GloFAS forecasts are run every day using the latest ECMWF ensemble forecast ENS and a cascade of hydrological models. This results in 51 possible streamflow predictions for the 30-day forecast horizon.
The results are summarised as a series of maps and point information accessible from the hydrological layers tab.
Flood forecast overview: threshold exceedance maps
Flood forecasts are summarised as maps showing:
- Maximum probability of exceeding the 5- and 20-year return period thresholds within the 30-day forecast horizon over the river network with upstream area larger than 1000km2 (respectively: ‘5 Year Return Period Exceedance’ and ‘20 Year Return Period Exceedance’ layers)
- Flood summary maps for three forecast periods (days 1-3, days 4-10 and days 11-30), over the river network with upstream area larger than 1000km2, combining the 2-, 5- and 20-year exceedance probabilities into a category-based information. It shows where the ENS-max (maximum of the ensemble mean discharge) in the forecast period is >20 year (purple) / 5-20 year (red) / 2-5 year (dark yellow). Light yellow indicates where the ENS-max is below the 2-year return period value, but there is noticeable probability (>20%) for exceeding the 2-year return period level (respectively: ‘Flood summary for days 1-3’, ‘Flood summary for days 4-10’ and ‘Flood summary for days 11-30’)
- Threshold exceedance icons highlighting reporting points. The colours are defined as follows: if the maximum ensemble mean discharge in the 30-day period is above 20-year the reporting point get purple colour, in 5-20-year red, in 2-5-year yellow. Below the 2-year level the colour is grey (with a square marker), unless the 2-year probability is above 20% in which case the colour is also yellow. The shape of the reporting point marker shows the trend in the 30-day period (circle: no trend; downward/upward triangles: decreasing/increasing flow) ('Reporting Points layer')
Forecast evolution and consistency: ensemble hydrographs and consistency diagrams
From the GloFAS forecasts ‘Reporting Points’ layer, two additional diagrams and basic statistics are provided for that river catchments when clicking on the coloured icons:
- Time series plots of the daily probabilistic discharge forecast (blue shading) to show the possible evolution of the flood wave over the next 30 days. The start of the forecast is shown as a round circle and the plot background is coloured according to the flood severity thresholds (green: 1.5-2-year; yellow: 2-5-year; red: 5-20-year and purple: above 20-year). The right axis shows discharge while the left axis denotes the return period equivalent of the discharge.
- Consistency diagrams of the probability of exceeding each of the three return period thresholds (2-, 5-, 20-year) for each day of the forecast horizon for the latest five consecutive forecast runs to show the evolution of the forecast signal in the probabilities.

Example snapshots of the rapid flood mapping (left) and the impact assessment (right) for GloFAS 30-day
Rapid flood mapping and impact assessment
As an experimental product in the 30-day forecasts, the 1km resolution flood extent is estimated with the potential related impacts on population and land use. Data are generated only for basins greater than 5,000 km2 and where the maximum return period is greater than 10 years. The role of flood defences is not considered. Two layers are available with:
- Rapid flood mapping: Estimated flood extent at 1km resolution based on the matching of return periods from the GloFAS river discharge forecast and a catalogue of modelled inundation extents.
- Rapid impact assessment: Potential impact of floods on population and land use (agriculture, urban) based on their intersection with the 1km resolution rapid flood mapping layer. Results are aggregated over administration regions. Colours represent the location within an impact matrix based on the time to peak GloFAS streamflow and how many people live within the footprint of the flood inundation.
Example of GloFAS Seasonal outlook showing river basin probabilities
(Layer "Seasonal Outlook - Basin Overview")
Example of GloFAS Seasonal outlook showing river network probabilities
(Layer "Seasonal Outlook - River Network" layer)
Example of forecast hydrograph and consistency diagram for GloFAS Seasonal. This is displayed as a pop-up window when clicking on the corresponding reporting point symbol.
GloFAS Seasonal: a river flow outlook for up to 16 weeks in advance
GloFAS Seasonal forecasts provide a global early indication of unusually high or low river flow up to 16 weeks. They are run every month using the latest ECMWF ensemble seasonal forecast and a cascade of hydrological models. This results in 51 possible streamflow predictions for the 16-week forecast horizon.
The results are summarised as a series of maps and point information accessible from the HYDROLOGICAL layer tab.
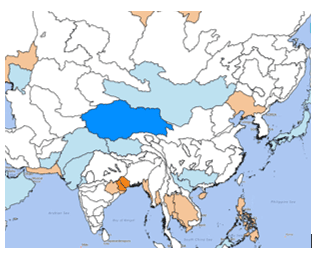
GloFAS Seasonal Overview: anomaly probability maps
GloFAS Seasonal outlooks are summarised as maps showing:
- Maximum area-averaged probability of unusually high (> 80th percentile, blue) or low (<20th percentile, orange) weekly river flow occurring during the four 4-month forecast horizon for 305 major world river basins.
- Maximum probability of unusually high (> 80th percentile, blue) or low (20th percentile, orange) weekly-average river flow occurring during the 4-month forecast horizon over the global river network for catchments greater than 1500km2.
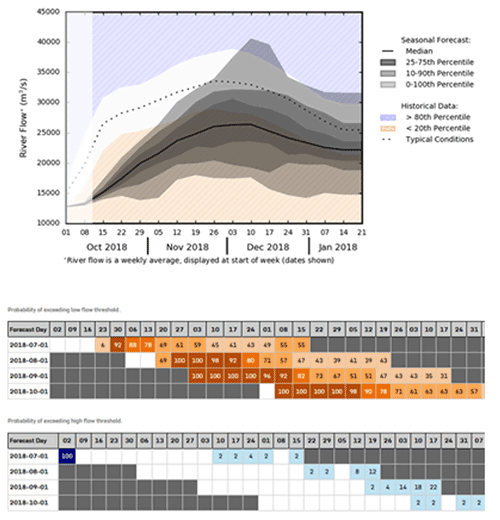
Seasonal outlook evolution and consistency: ensemble hydrographs and consistency diagrams
From the GloFAS Seasonal "Seasonal Outlook - Reporting Points" layer, two additional diagrams and basic statistics are provided for river catchments when clicking on the black circles:
- Time series plots of the probabilistic weekly-averaged discharge forecast (grey shading) to show the possible evolution of the river flow. The plot background is coloured according to the reference thresholds (blue: 80th percentile and above; orange: 20th percentile and below; dotted line: typical conditions 50th percentile).
- Consistency diagrams of the probability of exceeding the high (>80th percentile) and low (<20th percentile) thresholds for each week of the forecast horizon for the latest four consecutive forecasts to show the evolution of the forecast signal in the probabilities.
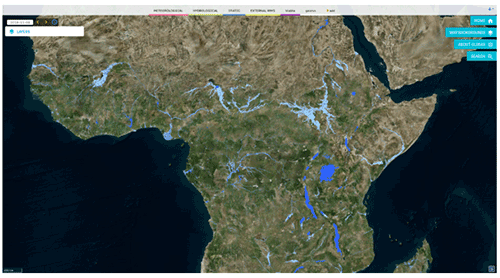
The "GloFAS lakes and reservoirs" layer
The "Major river basins" layer
The "Flood hazard 100-year return period" layer.
GloFAS background information: the static map layers
A number of additional layers with extra information are available via the GloFAS map viewer, that some users might find useful to overlay against GloFAS products. They are all available through the STATIC layer tab.
GloFAS lakes and reservoirs
This layer displays the open water bodies (lakes and reservoirs) that are included in the GloFAS model set up. Selection criteria are: (1) lake surface area > 100 km2; (2) significant impact on river discharge; (3) reservoir capacity > 0.5 km3.
Major river basins of the world
This layer shows the main river basins of the world, as defined by the Global Runoff Data Centre (GRDC). For more technical details see www.bafg.de.
100-year flood hazard map
A map of inundated areas and associated water depth for flood events with a return period of 100 years, based on GloFAS hydrological reanalysis and Lisflood-FP.

The "Upstream area" layer
Upstream area map
The GloFAS river network is plotted with river pixels above 1000 km2, represented by the upstream area (in km2).

The "Reservoir impact" layer
Reservoir impact map
Potential impact of reservoirs included in GloFAS on river discharge at global scale give as ratio of reservoir volume to mean annual discharge. This ratio makes use of the upstream cumulative reservoir capacity [m3] and the cell-specific total volume of annual natural river discharge [m3].

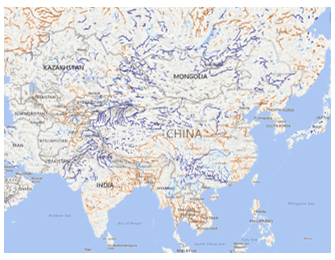
The "Major rivers" layer
Major rivers of the world
The layer is showing the major rivers.

The "Administrative regions" layer
Administrative regions
Administrative regions merged using NUTS-2 or NUTS-3 classification from EUROSTAT and the region classification from GADM.