Hydrological Services for Business workshop - 8-9 May 2018
Workshop summary
The workshop, attended by 55 participants from 17 countries, offered the opportunity for developers and users of GloFAS to meet, exchange ideas and influence the future directions of GloFAS and of hydrological services relying on it.
The 1.5-day workshop was structured as a mix of oral and poster presentations, interactive sessions, products training and discussion forums, to maximize the interactions between participants and the collection of feedback about GloFAS products (see agenda here). All presentations are publicly available online at https://www.ecmwf.int/en/learning/workshops/workshop-hydrological-services-business.
Session 1: Hydrological services and GloFAS
GloFAS (the Global Flood Awareness System) is an operational hydrological service of the Copernicus Emergency Management Service of the European Commission. It provides quick overviews of upcoming flood events and river outlooks up to 4 months ahead, served through an interactive forecast viewer. GloFAS products and services are available to all without restrictive use, except for Europe, through dedicated ftps tailored to each user need.
GloFAS is co-developed by the European Commission Joint research centre, ECMWF and the University of Reading, with support from downstream users such as the Red Cross Red Crescent Climate Centre (RCRCCC), the Regional Integrated Multi-Hazard Early Warning System (RIMES) and the National Centre of Natural Hazard Monitoring and Waring in Brazil (Cemaden), among many others.
For more information and registration for access to GLOFAS services, please visit: http://globalfloods.eu
Session 2: Defining business needs
Users’ needs must be at the centre of any hydrological service. But what are those needs? Following presentations by two different sectors (humanitarian aid and consultancies), an interactive session took place, with participants divided according to their activities.
Interactive session: hydrological services for business
The exercise was designed to find out important criteria defining a good Global Hydrological Service (GHS) through five leading questions, and ranking of answers by participants. The exercise was conducted by five self-governing groups defined by sectors: Users (19 participants); service providers (16 participants); Academia (8 participants); GloFAS Operational team (8 participants); GloFAS Development team (4).
Headline message
| 3 sectors or more | 2 sectors | |
| What is a GHS used for? | Local decision making Provision of information in regions lacking data Scientific and retrospective analysis | Knowledge exchange |
|---|---|---|
| How to select a GHS? | Quality of forecast Documentation Service reliability | Cost Availability of training material Data accessibility Resolution of forecasts Contextual information |
| What are the barriers of use of a GHS | Access to observations | Lack of awareness of the system Multiplication of sources Cost and resource for use Lack of local knowledge Perceived insufficient skill of forecasts Reliability of the service Data format |
| Elements missing from current GHS | Access to observations Local information integration Data assimilation techniques | |
| Criteria to define a good GHS | Overall forecast skill Forecast accuracy Forecast reliability | Reliability of service |
Session 3: Shaping the future of GloFAS
Co-design and co-development of their services is at the heart of the Copernicus Emergency Management Service for floods. This is achieved through an independent advisory board composed of academics and users, regular meetings and workshops, and consultations. Suggestions from users inform the possible evolution of the service.
After presentations from a service-design point of view and from the GloFAS operational team, four main functionalities were discussed in self-organised break-out groups through a set -of table top exercises designed to understand the workflow associated with different products and how the associated service could be made more efficient.
GloFAS forecasts feedback
The GloFAS forecasts flood forecast product was the first to be implemented operationally in GloFAS, and was designed during the pre-operational phase around 2011. The main aim of the exercise was to gather feedback on the usability of these products, what works, what is missing or incomplete, how to improve current products and what new products would help better support decision making.
The exercise required participants to advise on the planning or cancellation of a ministerial visit to India’s Gujarat state, based on 30-day GloFAS forecast products with lead time of 2 weeks, 9, 5 and 1 day. The criteria for cancelling the visit was the exceedance of the 1-in-20-year flood return flood period threshold.
| All groups | Two groups | One group | |
| Current performance | Good probability 2 weeks ahead Forecast accuracy greater at shorter lead times | ||
| Map viewer | Animated forecasts missing | Colours not intuitive | |
| Information type | More / flexible reporting points | Forecasts should be displayed at catchment scale | |
| Missing | Information on confidence / uncertainty | Time-to-peak maps Daily rainfall forecast | |
| New product | Summary bulletins for decision makers Multiple thresholds / composite maps | Risk maps Vulnerability indices Pluvial flooding |
GloFAS Seasonal
GloFAS Seasonal was released in a quasi operational mode in November 2018, after two years of development. The design of GloFAS Seasonal was based largely on feedback obtained on EFAS Seasonal, the hydrological seasonal outlook operational on the European domain from the CEMS-Floods EFAS service. The aim of the exercise, organised as an open discussion, was to gather feedback on the current products and how they could evolve.
Headline message
Can the GloFAS Seasonal products help reach an actionable decision?| Issues | Solutions |
|---|---|
| Product not yet trusted and used because lack of skill | Information on skill / how to make decisions |
| Temporal aggregation (outlooks averaged by weeks) not compatible with known level of skill | Volume forecasts defined as flow over 1 to 16 consecutive weeks |
| Spatial aggregation too coarse (mixed hydrological characteristics) | Work on regions based on climate categories and topography |
| Crossing the 80% / 20%ile thresholds does not reflect hydrological extremes | Use 90-95%ile / 10-5%ile thresholds |
What is currently missing from GloFAS Sesonal?
- Drivers of outlooks, i.e. initiation conditions (snow, soil moisture, …) and seasonal atmospheric forecasts
- Outlook of water balance components, i.e. snow storage, soil moisture etc… for downstream applications (e.g. reservoir management etc…)
- Simple hydrograph plots for non-specialists. More complex information to be provided for advanced users
- Information on skill from analysis of reforecasts
- Technology for users to assess the skill themselves
- User-defined temporal windows for the forecast (e.g. crop cycle)
- Dynamic spatial aggregation
GloFAS Rapid Risk Assessment
A new Rapid Risk Assessment product is envisaged for GloFAS and the aim of the exercise was to get feedback from a similar operational product already implemented in the European domain (EFAS) and gain insights on how to better shape the global version.
The exercise used the Paris flood of January 2018 as a case study, with participants being given snap shots of the EFAS Rapid Risk Assessment products.
Headline message
Familiarity with current risk productsRisk assessment products are known (e.g. from Environment Agencies, USGS …), but there is some uncertainty regarding how the EFAS risk matrix is defined (selection of spatial aggregation and risk thresholds).
Background information to be consideredThree main background information types were highlighted to build a useful risk matrix:
| Exposure | Hazard | ||
|---|---|---|---|
| Social | Physical | ||
| Critical | Population including density and vulnerable population Source: GHSL, WorldPop, local data where available | Infrastructure including critical (road, rail, hospitals, powerplants, water treatment) Source: World Bank, OpenStreetMap | |
| Important | Land Use and Land Cover Source: USGS, Copernicus | ||
| Could have | Defence / risk mitigation features Source: Flowpros database, local data, dynamic data on performance during flood | Forecasts tendency Source: GloFAS ensembles / probability tables | |
The mind map below summarises the main feedback received regarding the existing EFAS Rapid Risk Assessment products.
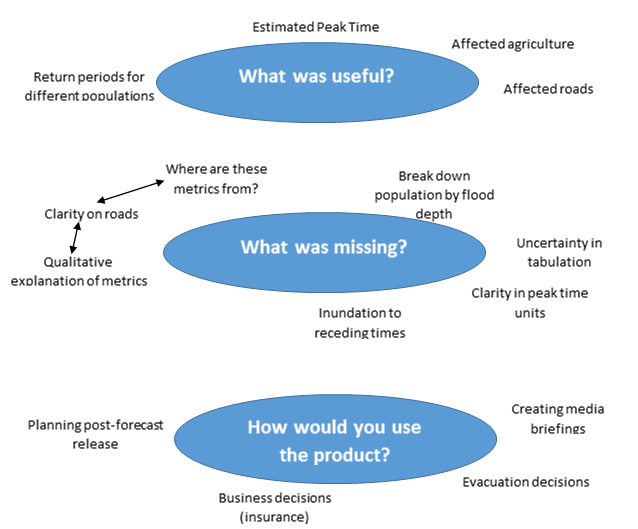
Shaping the future GloFAS Rapid Risk Assessment product - what is currently missing?
| Presentation | Information content | |
|---|---|---|
| Qualitative descriptions for users | Division of affected population by severity / depth | Historical records of floods and duration - MODIS / VIIRS |
| Statement on uncertainty | Vulnerable population - temporal population data e.g. refugees - from mobile phone data, Facebook or nightlights imagery | Gauge data (where available) |
| Evaluation of risk estimates | Critical infrastructure | Flood duration |
| Administrative and political boundaries (consistent e.g. GADM data) | ||
GloFAS weekly forecast summary
As part of GloFAS evolution, a new product providing a GloFAS weekly forecast summary is under development. The aim of the exercise was to gather early feedback and ideas to help shape the product development, including preferred content, length, presentation, and delivery mechanism(s).
Headline message
Summarising forecasts to respond to varying users’ needs would be challenging, as interests differ on lead time (short, medium, long range), forecast aspect (flood vs flow volume forecasts), spatial scale (catchment vs continental scale), and application (emergency response, business sector etc…). A customised dash-board would be more effective in delivering products responding to users’ needs (regional zoom, combination of products) and should include information on skill.
Session 4: Service provision
Successful hydrological services need to be a user-designed, with efficient service provision, so that downstream applications can benefit most from the offered information. The final interactive session of the workshop aimed to identify the type of practical applications users might undertake with data from a hydrological service. It followed presentation of two practical examples of downstream application (the Copernicus Climate Data Store and Tool box, and the ‘Rapid’ streamflow forecast).
Interactive session: GloFAS workflow and user stories
Following the format of user stories, participants were invited to describe the workflow and applications they would develop from a global hydrological service. Results were analysed in terms of functionalities (service, content).
Headline messages
Data access
| What | Why |
|---|---|
| Local river flow forecasts (time series simulations), both in real-time through web services and archiving facilities, | Downstream applications |
| Forecasts from the terrestrial water cycle (soil moisture, snow water equivalent, evaporation etc…) | Downstream applications |
| River flow past forecasts | User verification |
| Historic and real-time gauged river flow, or flood event data | User own research analysis |
| Weather forcing data (real-time/ forecast) | User to develop own hydrological forecasting system |
Information content
|
What |
Why |
|
Tutorial and case study datasets |
Training |
|
Documentation (detailed and for non-expert) |
Better understanding of limitations of the system |
|
Dynamic graphic facilities to extract summary information for user-defined points/ regions |
Better assessment of areas affected for flood events |
|
Summary forecast bulletins |
Easy assessment of the situation by non-experts |
|
Forecast verification metrics |
User’s own evaluation of forecast value in their area of interest |
|
Impact forecasts including surge floods and inundated areas |
Downstream actions |
|
Forecasts of the full river flow regime, including droughts |
Downstream actions |
Modelling framework
|
What |
Why |
|
Interactive calibration tool |
Improved performance on user’s area of interest |
|
On-demand real-time data assimilation |
Improved forecasting performance |
|
Ability to run own experiments on global forecast modelling chain |
Quantifying modelling uncertainty and comparing with other forecasting systems |
|
High-resolution forecasts (<100m) |
Downstream applications |